50+ Mind-Blowing eCommerce Statistics for 2021

The business of eCommerce is booming. 2020 saw more online sales than ever before as the COVID-19 pandemic forced people into their homes and the closure of brick-and-mortar stores. Millions of businesses all over the world have shifted to an online model to meet the growing demand for shopping online.
In 2021 the future has never looked brighter for eCommerce. If you’ve been thinking about starting that online store but just haven’t got around to it yet, these eCommerce statistics could just be the motivation you need.
# General eCommerce Statistics
eCommerce is a fantastic business model, whether you’re starting from scratch or looking for ways to expand your current business. It’s possible to get started with very little money, and you don’t need a huge team of people to run an eCommerce store. Not convinced? Just consider some of these eCommerce trends and statistics for 2021 and beyond.
1. 2020 was the biggest year ever for eCommerce so far
Sales during the COVID-19 pandemic were at an all-time high, with 84% of consumers shopping online during the pandemic. At the height of the pandemic, “10 years of eCommerce growth happened in just 90 days”
Source: https://www.shopify.com/future-of-commerce/2021
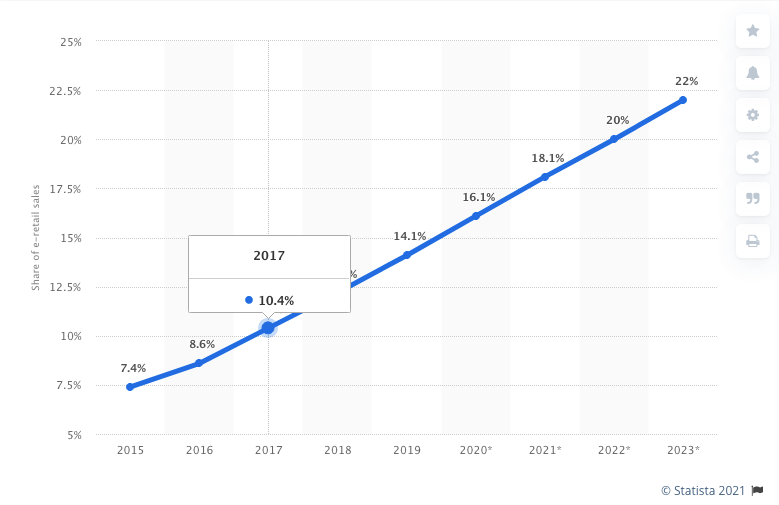
2. eCommerce is predicted to account for 22% of all retail sales by 2023
eCommerce as a share of global retail sales grew from 7.4% in 2015 to 14.1% in 2019, according to a 2020 survey. If the current rate of growth continues, it should reach 22% by 2023.
Source: https://www.statista.com/statistics/534123/e-commerce-share-of-retail-sales-worldwide/
3. 96% of US consumers have made at least one online purchase
Shopping online is no longer a niche activity. The vast majority of US shoppers have made online purchases and a massive 80% have shopped online in the last month.
Source: https://www.shopify.com/enterprise/global-ecommerce-statistics
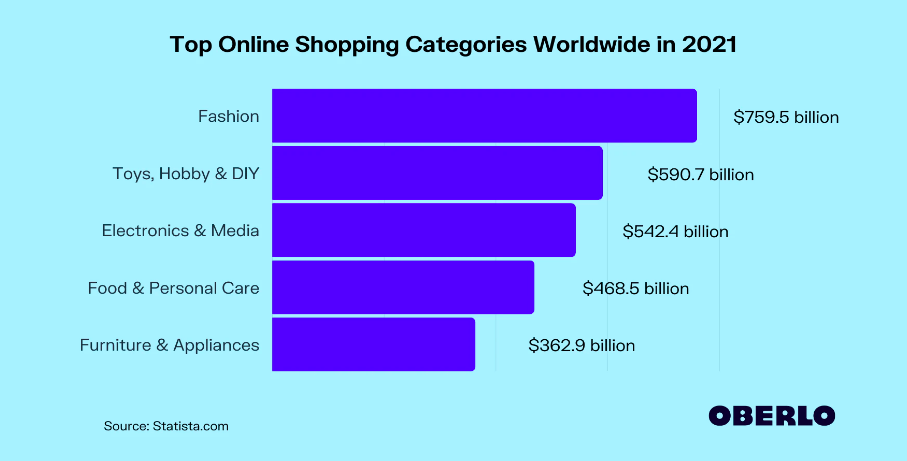
4. Fashion; Toys, hobby & DIY; and Electronics and media are the most popular online shopping categories
Wondering what products you should sell? Consumers worldwide are forecast to spend $795.5 billion on fashion in 2021, accounting for 27.9% of eCommerce revenue worldwide. Food & personal care and furniture & appliances also make the top 5 categories.
Source: https://www.oberlo.com/statistics/top-online-shopping-categories
5. 57% of online shoppers globally make purchases from retailers overseas
When you start an eCommerce business, you’re not restricted to just your local market to look for customers. Overseas purchases make up the majority of online shopping activity in Europe, Asia-Pacific, Africa, and Latin America.
Source: https://www.shopify.com/enterprise/global-ecommerce-statistics
6. Over 92% of shoppers online prefer to purchase in their own currency
Despite the acceptance of global eCommerce, 33% of online shoppers outside the USA said they would abandon a purchase if the pricing was listed only in USD – something to keep in mind when you’re setting up your store.
Source: https://www.shopify.com/enterprise/global-ecommerce-statistics
7. Three-quarters of US consumers are more likely to buy a product if it is packaged sustainably
You need to consider more than just the products you sell. The majority of consumers agree that the design of the packaging can influence their purchase decisions. Most prefer to buy products packaged in paper and cardboard because it is better for the environment and can make a product seem higher quality.
Source: https://www.ipsos.com/en-us/news-polls/Most-Americans-Say-That-the-Design-of-a-Products-Packaging-Often-Influences-Their-Purchase-Decisions
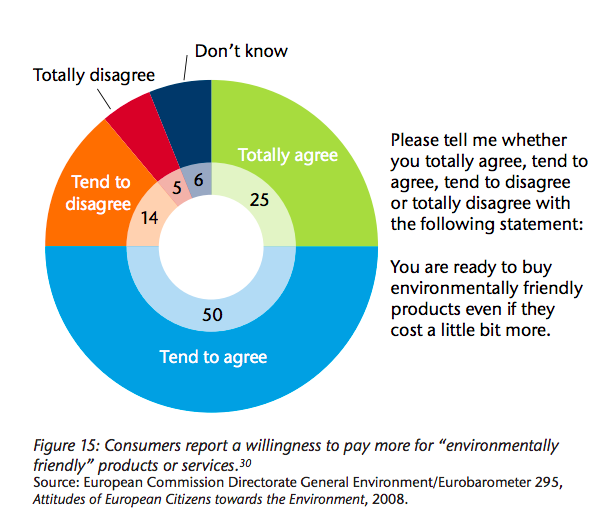
8. 75% of consumers agree they would pay more for environmentally friendly products
According to a study of consumers in developing and developed markets including China, Australia, Sweden, and the US, only 5% of respondents completely disagreed that they would buy environmentally friendly products if they cost a little more than non environmentally friendly options.
Source: https://saiplatform.org/uploads/Modules/Library/WBCSD_Sustainable_Consumption_web.pdf
9. 28% of consumers say they will continue to shop mostly online after the pandemic
It seems COVID-19 may have changed shopping habits for good. 39% of shoppers plan to do a combination of shopping online and in store, and less than a quarter say they are looking forward to shopping in store again.
Source: https://www.socialmediatoday.com/news/ecommerce-statistics-and-trends-2020-infographic/589593/
# eCommerce platform statistics
Where do you go when you shop online? Multi-vendor marketplaces like Amazon are giants in the world of eCommerce, but there’s still room for the little guy.
Consumers are starting to realize the importance of shopping with independent retailers to find more unique products and support small businesses that have been affected by the pandemic.
And if you have an eCommerce business, there’s no reason why you can’t do both – it’s possible to list your products on big sites like Amazon as well as setting up your own online store on a platform like Shopify or WooCommerce.
10. Half of all eCommerce sales occur on marketplaces
Consumers are increasingly choose to shop on multi-brand marketplaces like Amazon rather than going directly to the brand website to buy. Most consumers are looking for particular products and solutions, rather than searching for brands.
Source: https://www.shopify.com/enterprise/the-future-of-ecommerce/brand-development
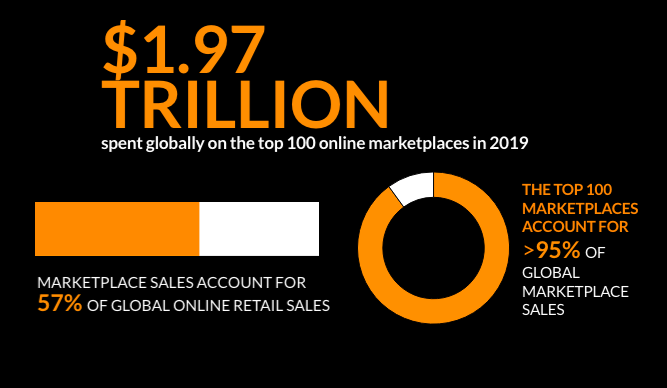
11. 93% of consumers have shopped on a marketplace
Nearly $2 trillion are spent annually at the top 100 marketplaces, with customers attracted by the wide range of products and brands available, often at lower prices than elsewhere.
Source: https://www.digitalcommerce360.com/article/infographic-top-online-marketplaces/
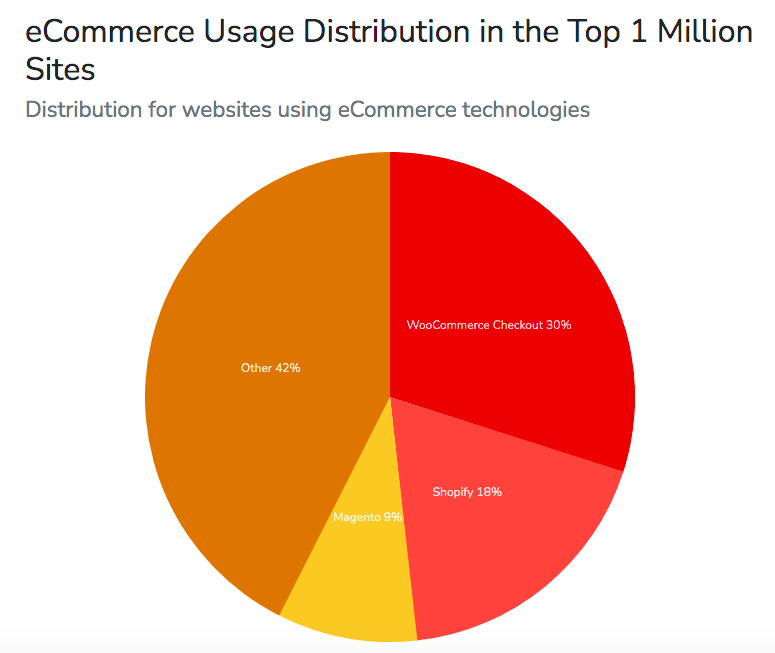
12. WooCommerce is the top eCommerce platform online, accounting for 30% of eCommerce websites
WordPress powered WooCommerce takes the lion’s share of the marketplace, and is the platform of choice for almost a third of all eCommerce stores on the web. Shopify takes next place at 18%, and Magento comes in third at 9%.
Source: https://trends.builtwith.com/shop
13. Shopify year-on-year revenue grew 47% in the first quarter of 2020
Fueled by the surge in entrepreneurship in 2020, the number of Shopify stores has exploded over the last year. While Shopify is still not the most popular eCommerce platform overall, its ease of use for people with no technical or coding skills means that its market share is likely to continue growing.
Source: https://news.shopify.com/shopify-announces-first-quarter-2020-financial-results
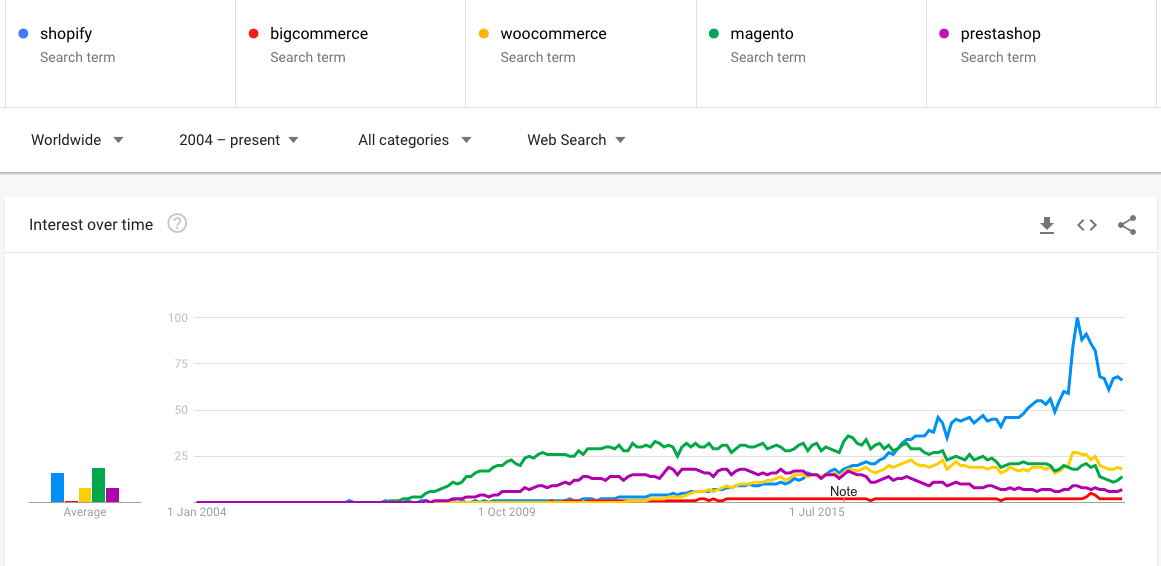
14. Shopify is the most searched for eCommerce platform on Google
Searches for Shopify have outnumbered searches for WooCommerce, Magento, Big commerce, and Prestashop for some time. According to Google trends, Shopify took the lead in mid 2017 and has remained there ever since.
Source: https://trends.google.com/trends/explore?date=all&q=shopify,bigcommerce,woocommerce,magento,prestashop
15. Over 90% of US consumers use or would consider using AR for shopping
Store closures forced by the pandemic have meant the use of augmented reality in eCommerce is on the rise. Furthermore, 98% of those who have used AR while shopping online have found it useful. Shopify is currently the only eCommerce platform that offers built-in AR functionality
Source: https://www.thinkwithgoogle.com/consumer-insights/trending-data-shorts/augmented-reality-shopping-data
16. WooCommerce is one of the web’s most popular WordPress plugins
With over 5 million active installations, it seems the ability to add eCommerce functionality to your website is just as essential as a contact form, spam protection, page design, and SEO.
Source: https://wordpress.org/plugins/browse/popular/
17. There are over 4.4 million sites worldwide using WooCommerce
Over 1,300 of these sites have an estimated sales revenue of over $1 million. The highest earning sites using WooCommerce include Meraki by Cisco (estimated sales revenue $29m+), Godaddy (estimates sales revenue $24m+) and WooCommerce itself (estimated sales revenue $2.4m+)
Source: https://trends.builtwith.com/websitelist/WooCommerce/$1m-Sales-Revenue
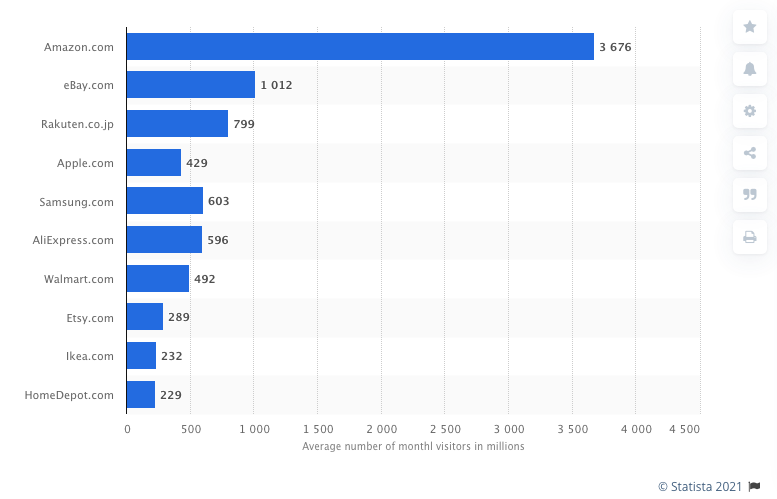
18. Amazon, eBay, and Walmart are the most popular eCommerce stores in the USA
Etsy, Home Depot, Target, Best Buy, Wayfair, Macy’s, and Lowe’s also make it into the top 10. Globally, Amazon still takes the top spot, with Japanese Rakuten.co.jp and Chinese Aliexpress.com also appearing in the top 10.
Source: https://disfold.com/top-e-commerce-sites-us/ https://www.statista.com/statistics/274708/online-retail-and-auction-ranked-by-worldwide-audiences/
# Email eCommerce Statistics
Running a successful eCommerce business is about more than just setting up a good website. You also need to attract customers to your site and encourage them to buy. One of the best ways to do this is with email marketing.
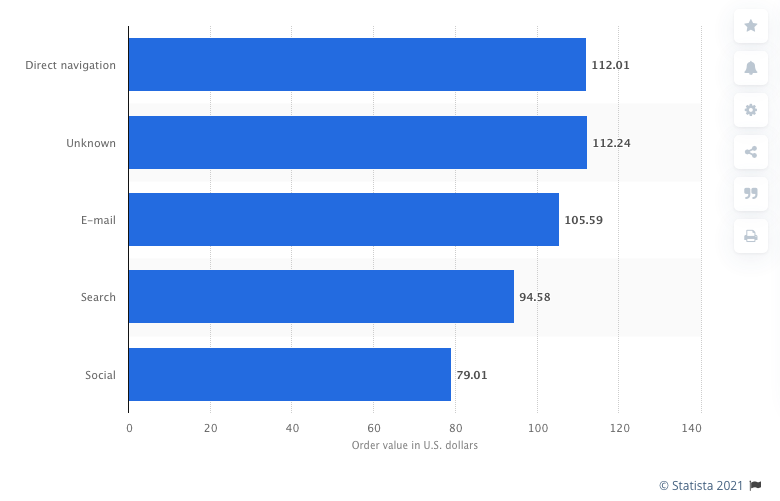
20. Email traffic generates the highest revenue in sales
According to data collected in the second quarter of 2019, orders generated from email traffic were worth an average of $105.59, with search and social media traffic sources being worth 94.8 and 79.01 respectively.
Source: https://www.statista.com/statistics/325384/online-shopping-order-values-traffic-source/
21. 51% of US consumers prefer brands to contact them via email
According to a 2019 survey, over half of the respondents said email was their preferred contact method from brands. Social media came in second at 25%.
Source: https://www.statista.com/statistics/750858/us-consumers-preferences-brand-contact/
22. Emails with personalized subject lines are 26% more likely to be opened
Most brands agree that personalization is very important in email marketing. 50% of companies feel they can increase interaction with their emails by improving personalization.
source: https://www.campaignmonitor.com/resources/infographics/24-email-marketing-stats-need-know/
23. Customers who receive abandoned card emails are 2.4 times more likely to complete their purchase
Triggering an automatic email on cart abandonment could make a big difference to your sales.
Source: https://www.campaignmonitor.com/resources/infographics/24-email-marketing-stats-need-know/
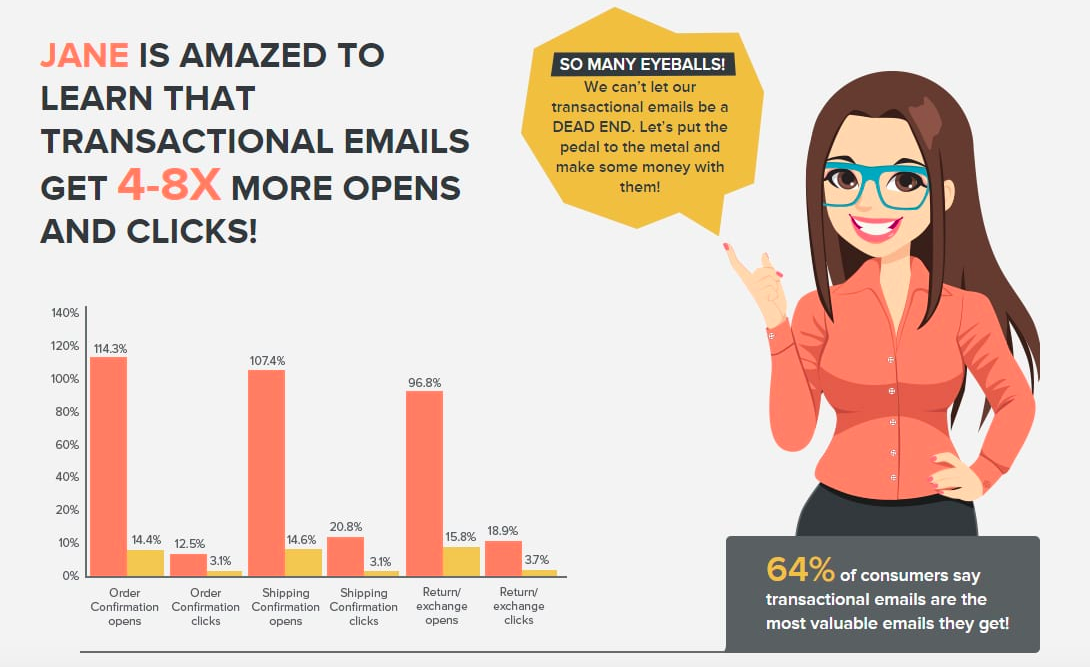
24. Transactional emails get 4-8 X more opens and clicks
64% of consumers say that transactional emails (those that are triggered by an action such as signing up to a newsletter or making an order) are the most valuable in their inbox.
Source: https://www.smartinsights.com/email-marketing/behavioural-email-marketing/transactional-emails-show-roi-infographics/
25. Welcome emails receive 3 X more orders and revenue than normal promotions
Enticing new customers to make a purchase with a one-off discount code can attract more sales than any other type of promotion. 73% of consumers say they sign up to ecommerce mailing lists to receive discount codes
Source: https://www.smartinsights.com/email-marketing/behavioural-email-marketing/transactional-emails-show-roi-infographics/
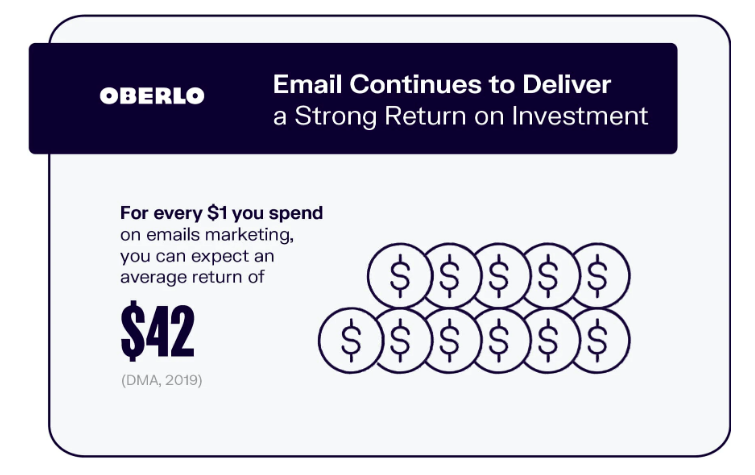
26. Email marketing has an average ROI of 4,200%
The ROI of email is higher than any other marketing technique, offering a return of $42 on every $1 spent, on average.
Source: https://www.oberlo.com/blog/email-marketing-statistics
27. 60% of consumers say they have made a purchase because of a marketing message they received via email
Think email isn’t worth the effort? Think again – the majority of consumers have bought something because of an email promotion. 44% will actually check their inbox for shopping deals.
Source: https://optinmonster.com/email-marketing-vs-social-media-performance-2016-2019-statistics/
28. 38% of consumers want to receive promotional emails more often than once a week
If you’re sending email offers to your customers only once a month, it probably isn’t enough. 61% of consumers say that weekly emails are their preference.
Source: https://blogs.constantcontact.com/email-marketing-statistics/
29. Emails sent to segmented audiences get 50% higher click-through than email sent to non-segmented audiences
Segmenting your email list is well worth the effort. This could mean something as simple as sending out two different emails promoting your men’s and women’s clothing ranges, for example.
Source: https://www.helpscout.com/list-building/#the-awesome-power-of-segmentation
# Social media eCommerce statistics
We’re living in the social media age and it’s pretty much essential for brands to have some kind of presence on social media if they want to succeed. Social media networks are a great place to build a following and engage with your customers.
30. 37% of internet users aged 18-34 have purchased something via social media
Over a third of internet users in the 18-34 age bracket have made at least one purchase via social media and 11% shop via social media regularly.
Source: https://www.statista.com/statistics/973404/internet-users-interest-purchasing-products-social-media-usa/
31. 60% of Instagram users say they discover new products via the platform
Want to market your new product? Instagram might be the way to go. An Instagram user survey found that the majority of users had discovered new products while using it
Source: https://influencermarketinghub.com/social-commerce-stats/
32. The average ROI of influencer marketing on TikTok is $6.50 for every $1 spent
Think TikTok is just for kids? Don’t underestimate the future spending power of teenagers. Over 30% of US and European consumers said they had made a purchase based on an influencer’s recommendation
Source: https://www.socialbakers.com/blog/how-to-work-with-influencers-on-tiktok
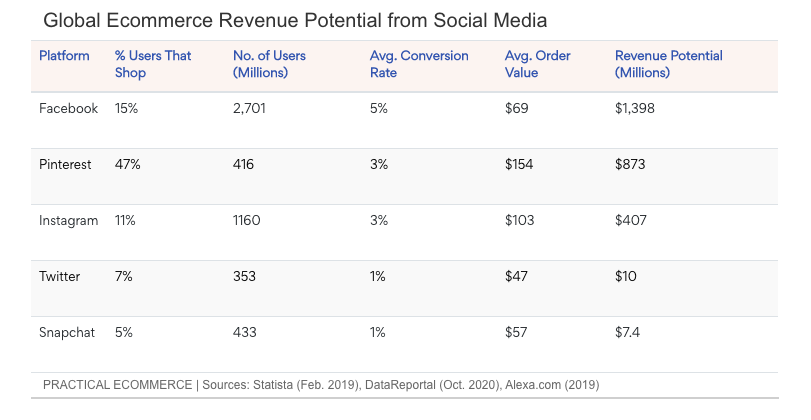
33. Pinterest users generate the highest average order value at $154
Pinterest is a popular tool for inspiration but people also go there to look for products. Almost half of Pinterest users shop on the site, compared to 15% for Facebook and 11% for Instagram.
Source: https://www.practicalecommerce.com/charts-social-medias-impact-on-ecommerce-revenue
34. 74% of consumers rely on social media to help them make purchasing decisions
Most social media users use their networks to learn about brands and products, look for discounts and sales, and seek out opinions on products and services
source: https://awario.com/blog/how-social-networks-influence-74-of-shoppers-for-their-purchasing-decisions-today/
35. 1 in 4 business owners sell through Facebook
40% of merchants use social media in general to drive sales
Source: https://www.smartinsights.com/ecommerce/social-commerce/social-commerce-trends-for-2020-you-need-to-look-out-for/
36. 130 Million Instagram users tap on shopping posts every month
Instagram has a feature that allows brands to link to products and sell directly from their Instagram feeds. We know this feature works because users are actually tapping the posts to go straight to the product details.
https://blog.hootsuite.com/instagram-statistics
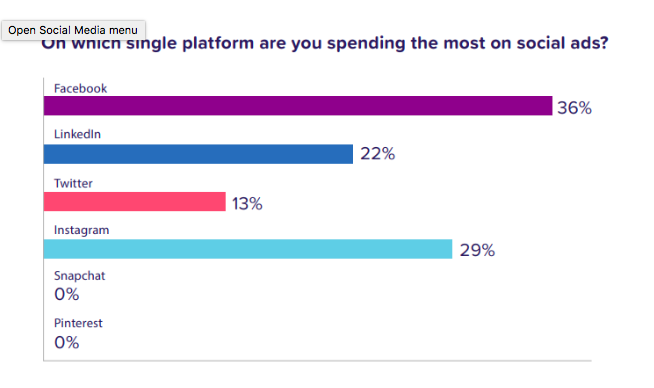
37. 50% of marketing teams spend half their budget on social ads
Facebook and Instagram are the most popular platforms for paid ads for brands. This is a good indication that they’re the platforms producing the best results at the current time.
Source: https://sproutsocial.com/insights/instagram-stats/#ad-stats
38. 45% of retailers plan to spend more on social media advertising in 2021
76% said they would be increasing their spending on Facebook advertising. This may be at the expense of other platforms – almost a quarter were planning to reduce their advertising spend on Twitter and Instagram.
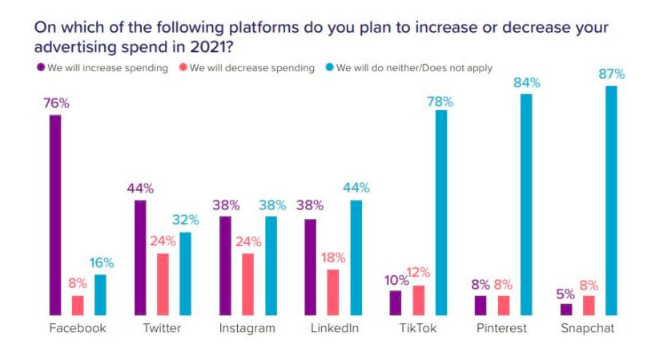
Source: https://www.clickz.com/45-of-retailers-plan-to-spend-more-on-social-media-advertising-in-2021-vs-2020/265077/
39. Online stores that have at least one social account make 32% more sales than stores that don’t use social media
The effect of social media on overall sales is multi-faceted. Social media not only drives direct traffic to products, but also boosts brand awareness and reputation.
source: https://www.bigcommerce.com/blog/5-social-stats-for-online-storeowners/
Mobile eCommerce statistics
Internet users are no longer sat at their desks on a laptop. Instead, they’re more likely to be on the go, browsing and shopping from their mobile devices.
This is especially true in emerging markets in Asia, South America, and the Middle East, which are predicted to overtake US spending in the coming years, joining China as a multi-billion online economy.
40. 73% of global eCommerce sales will be made on mobile devices by the end of 2021
Mobile sales as a total share of eCommerce has continued to grow year on year since 2016, driven by domination of mobile devices in emerging markets.
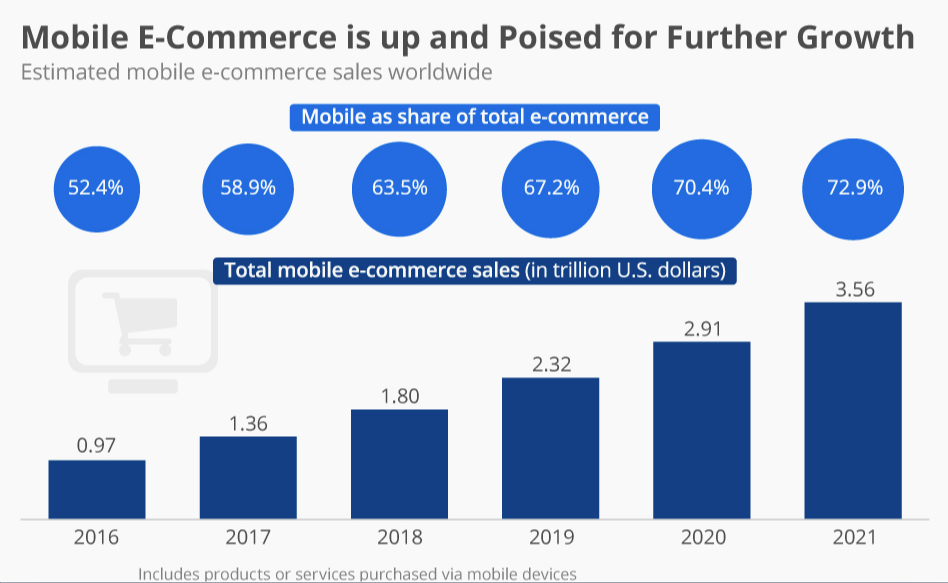
Source: https://www.statista.com/chart/13139/estimated-worldwide-mobile-e-commerce-sales/
41. Two thirds of internet users use shopping apps on their mobile devices
Consumers are no longer using their mobile devices for research and entertainment purposes only. 51% of smartphone users buy products online with their mobile devices, and 66% use shopping apps.
Source: https://datareportal.com/reports/digital-2020-april-global-statshot
42. 59% of online shoppers agree that having the option to shop via mobile is important.
According to research by Google, 59% of the shoppers surveyed said that they took this into consideration when choosing which brands or retailers to buy from.
https://www.thinkwithgoogle.com/consumer-insights/consumer-trends/mobile-shopping-brand-decision-statistics/
43. 7 in 10 consumers prefer to shop on a mobile website rather than a mobile app
While the majority of mobile device users may use shopping apps, research shows that most consumers prefer to use a website over an app. So it’s vital to ensure your website is designed for mobile.
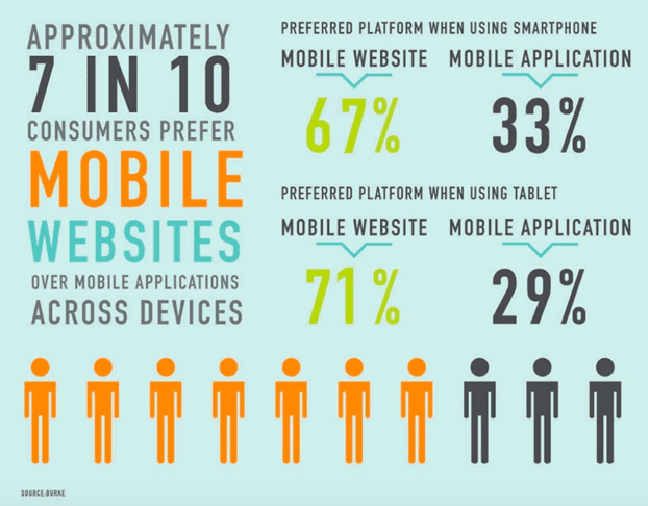
source: https://www.readycloud.com/info/rethinking-e-retailing-game-changing-mobile-ecommerce-statistics-paint-the-real-picture
44. Cart abandonment rates increase to 78% for mobile users
The cart abandonment rate for shoppers on their mobile phones is much higher than desktop users, which averages at 67%. This is probably due to sites that aren’t optimized for mobile, forcing shoppers to switch to another device to complete their purchase.
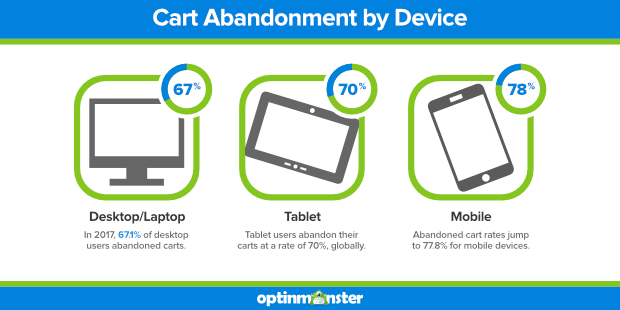
https://optinmonster.com/cart-abandonment-statistics/
45. The use of mobile payments is expected to grow by nearly 27% between 2020 and 2025
Payment applications such as Paypal, Apple Pay and Amazon Pay are continuing to become more popular. The mobile payments industry is expected to hit over $4.5 billion by 2023
Source: https://www.simicart.com/blog/m-commerce-statistics/
46. 61% of Google searches are made on mobile devices
The use of mobile for search overtook desktop in 2016 and continues to grow each year.
Source: https://www.statista.com/statistics/275814/mobile-share-of-organic-search-engine-visits/
# Shopping cart statistics
Standing between the customer browsing for products and them actually giving you their money is the shopping cart. So it’s vital that you pay attention to how you can optimize your shopping cart process to make more sales and avoid anything that could lose a customer at the final stage.
47. The total transaction value of digital payments is expected to grow by around 12% annually
While credit cards are the most popular payment method globally, being used in over 50% of transactions, digital payment systems are most popular in China and Europe
Source: https://www.statista.com/outlook/dmo/fintech/digital-payments/worldwide
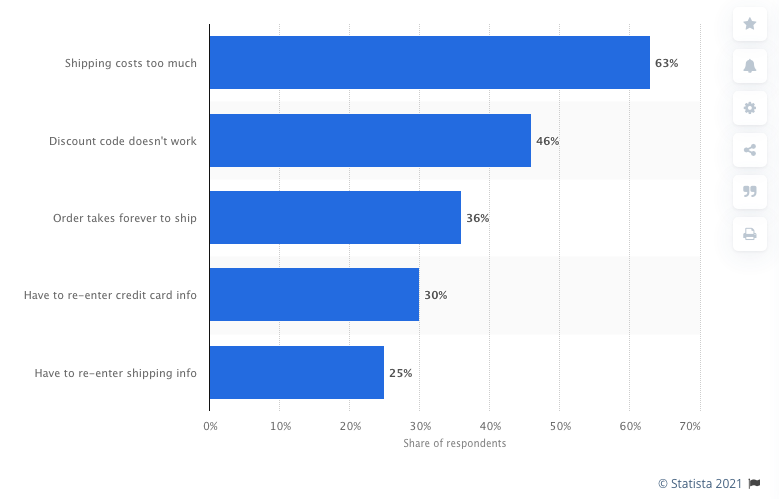
48. 63% of cart abandonments are due to extra shipping costs
Additional reasons for cart abandonment include discount cards not working, shipping times that are too long, and having to re-enter credit card or shipping info.
https://www.statista.com/statistics/379508/primary-reason-for-digital-shoppers-to-abandon-carts/
49. PayPal transactions have 70% higher checkout rates than non-PayPal transactions
The ease of use of PayPal transactions combined with trust of the PayPal brand means that offering it as a payment option could help to keep cart abandonment rates low.
Source: https://www.paypalobjects.com/webstatic/mktg/pdf/PayPal_Checkout_Best_Practices.pdf
50. 64% of consumers want their orders to be shipped for free
Customers are increasingly demanding fast and free shipping and using this as a differentiator between different retailers online. 65% of consumers check free shipping thresholds before adding an item to their cart and most consumers say free shipping greatly impacts whether they buy from a brand or not.
Source: https://www.shopify.com/enterprise/the-future-of-ecommerce/shipping-and-logistics
51. Improving checkout design can increase conversion rate by over 35%
Making some simple design improvements to checkout such as simplifying forms can drastically reduce the cart abandonment rate and increase the number of completed purchases.
Source:https://baymard.com/blog/ecommerce-checkout-usability-report-and-benchmark
Conclusion
In a market that moves as fast as eCommerce, it’s critical to keep track of statistics and trends so that you can optimize your online store and get the most out of your marketing efforts.
While no eCommerce business is guaranteed to succeed, by making wise choices about what you sell, the platform you use, and how you attract customers, you could be on track for making a lot of money.
Leave a Reply